
The Dimensional Difference
Every investment strategy at Dimensional is driven by a research-backed approach designed to maximise returns while minimising costs and risk.
Aim higher
The Dimensional difference is the outperformance we aim to deliver over benchmarks and peers by applying the science of investing.
At Dimensional, we pursue this return advantage through a data-backed, repeatable approach to implementation that we have been fine-tuning for more than four decades. This implementation advantage has allowed us to beat the performance of both traditional active funds and passive index funds.
How many funds beat their benchmark over the past 20 years?
Index Funds

Indexers only try to match a benchmark, not beat it.
Traditional Active Funds
14%
Dimensional Funds
75%
US domiciled mutual funds and US domiciled ETFs are not offered for sale outside the US. Past performance is no guarantee of future results.
Solutions to match investors’ goals
Investors can choose from a wide range of solutions to pursue their portfolio goals. Our strategies include targeted Component Equity, broad-market Core Equity, and Multi-Asset allocations.


These strategies are available as managed funds through Dimensional’s World Allocation Trusts, or Dimensional Wealth Models.
A full range of investment solutions backed by financial science
To learn more about how we work with financial professionals to deliver a better way to invest, send us a message. If you prefer, contact our client service team at +61 (2) 8336 6556 for financial advisors and at +61 (2) 8336 7194 for institutional investors.
Footnotes
-
1. The strategies target equity allocations of 30%, 50%, 70%, and 100%, relative to fixed income. The series also includes a World Equity Trust, which reflects 100% allocation to equities based on world market cap weights.
glossary
Diversification: Holding many securities or types of investments in a portfolio, often for the purpose of mitigating risk associated with owning a single security or type of investment.
Relative price: A company’s price, or the market value of its equity, in relation to another measure of economic value, such as book value.
Profitability: A company’s operating income before depreciation and amortisation minus interest expense scaled by book equity.
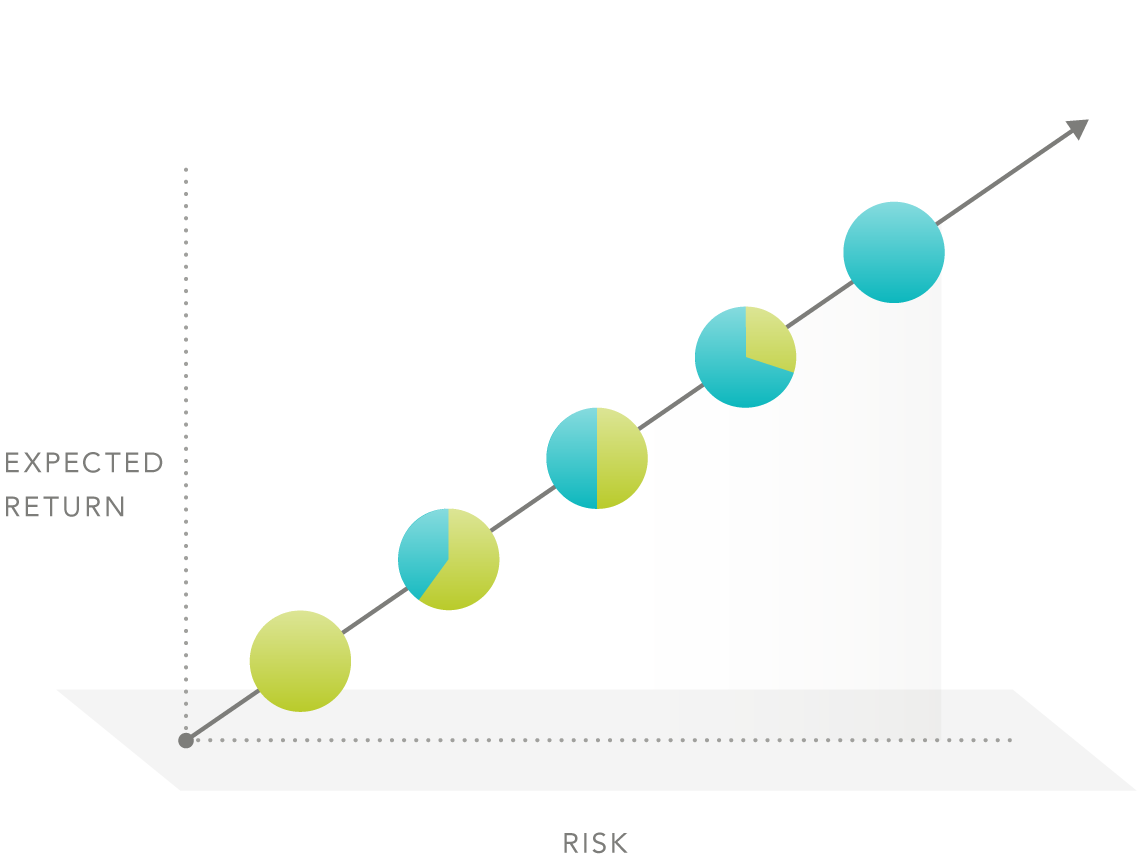
Expected return: An estimate of average anticipated returns informed by historical data.
DISCLOSURES
Investments involve risks. The investment return and principal value of an investment may fluctuate so that an investor’s shares, when redeemed, may be worth more or less than their original value. Past performance is not a guarantee of future results. There is no guarantee strategies will be successful.
Diversification neither assures a profit nor guarantees against loss in a declining market.
The material contained on this site has been issued by DFA Australia Limited (AFS Licence No.238093, ABN 46 065 937 671).
Investors should also consider the Product Disclosure Statement (PDS) and the target market determination (TMD) that has been made for each financial product either issued or distributed by DFA Australia Limited prior to acquiring or continuing to hold any investment. Go to dimensional.com/funds to access a copy of the PDS or the relevant TMD. Any opinions expressed in this material reflect our judgement at the date of publication and are subject to change.
Nothing on this website shall constitute or serve as an offer to sell products or services in any country or jurisdiction by any Dimensional global firm. For informational purposes only. All information is given in good faith and without warranty and should not be considered investment advice or an offer of any security for sale.
DFA Australia Limited (“Dimensional”) makes available certain model portfolios (“Dimensional Models”) for informational, illustrative and educational purposes only. The Dimensional Models are provided “as is.” Dimensional has no obligation to continue to maintain or take any other action with respect to the Dimensional Models and may stop providing any update to the Dimensional Models at any time in its sole and absolute discretion. Dimensional is providing information in the form of Dimensional Models as ideas for possible construction of portfolios centered around the Dimensional Trusts and not as financial product advice, recommendations or research. Dimensional is not responsible for models constructed by a user of the Tool (“User-Constructed Models”) or any modifications to the Dimensional Models made by a user of the Tool (the Dimensional Models and the User-Constructed Models, and any user modifications thereto, collectively, the “Models”). Dimensional is not responsible for implementing the Models (e.g., selecting brokers, executing trades or seeking best execution).
Dimensional is not providing any investment, tax or financial product advice to any investment professional or their clients, and has no obligation to and will not take into account the tax status, investment objectives, financial situation or needs of any investment professional or their clients when compiling the Dimensional Models. Dimensional is not acting as a fiduciary to any investment professional or their clients, nor is any investment professional or their client entering into any type of advisory or other relationship with Dimensional. The investment decisions made by any investment professional or their clients based on the Dimensional Models provided shall be at the investment professional’s or such client’s own risk and Dimensional makes no guarantee as to the merits of any Dimensional Model or Dimensional Trusts selected for a Model. The Dimensional Models are not intended as a sufficient basis on which to make an investment decision. Certain investments included in the Models may not be suitable for investors, nor do they represent a complete investment program.
To the fullest extent permitted by applicable law, Dimensional shall have no liability, including with respect to the accuracy of any data or caused by any action taken in reliance upon the Dimensional Models, to any investment professional or their clients in relation to the Dimensional Models.
Any indices shown are intended for comparative purposes only and may differ significantly from the Models. Dimensional makes no representations as to the appropriateness of any of the indices in comparison to the Models. The risk factors, benefits and disadvantages of the indices and Models may vary greatly and should be considered alongside fund characteristics, holdings and past performance figures stated. Although the Models were created using information developed internally and/or obtained from sources believed to be reliable, Dimensional does not guarantee the accuracy, adequacy or completeness of such information.
The Dimensional research and portfolio management teams (the “Model Team”) developed the Dimensional Models. The Model Team, with oversight from Dimensional’s Investment Committee, generally expects to select funds for the Models managed by Dimensional (“Dimensional Trusts”) without considering the universe of funds sponsored by persons not affiliated with Dimensional or its affiliates (“Third Party Funds”), even though there may or may not be Third Party Funds that may be more appropriate for inclusion in such Dimensional Models. To the extent a user implements all or part of a Model, this will generate advisory and other fees for Dimensional or its affiliate, and the management fees of Dimensional Trusts may be higher than fees charged by Third Party Funds. The Dimensional Models asset allocation represent the selected target asset mix as determined by the Model Team and as of the date it is provided.
The risks of the Dimensional Models are subject to the risk of the Dimensional Trusts, which can be found in the applicable Dimensional Trust Product Disclosure Statement (PDS). The selection of Dimensional Trusts and the allocation and reallocation of Dimensional Model assets may not produce a desired result.